

By: Jon Costello
Six months ago, the war with Iran sent oil prices sharply higher. We have now entered the period when history says U.S. oil production should begin responding.
The next several months will test the argument I made in late August about the geology behind slowing U.S. shale growth. If $90 to $100 oil cannot produce much more U.S. supply, the longer-term oil market will look very different.
Why Production Takes Time to Respond
The EIA has long estimated that oil rigs follow changes in WTI prices with a lag of about four months, while production follows the rigs about two months later. That puts the historical lag from a significant change in oil prices to production at roughly six months.
The reason is straightforward. Producers must decide that higher prices justify more investment, contract rigs and crews, drill and complete wells, and connect them to pipelines. Even shale cannot respond overnight.
Six months is only a rule of thumb. After oil prices peaked in June 2014, U.S. production kept rising for another 10 months. After prices bottomed in February 2016, production kept falling for seven. Those episodes point to a response to this year’s price increase between September and December. We are at the beginning of that window, not the end.
The table below compares those episodes with this year’s. It also shows how modest this year’s drilling response has been. In the four months after drilling bottomed in 2016, the oil rig count rose 30% with WTI averaging about $46 per barrel. In the four months after April of this year, it rose only 10% with WTI averaging about $88.

The Price Signal Has Been Hard to Miss
WTI averaged $64.51 per barrel in February, then $91.38 in March, $100.32 in April and $102.13 in May.
Drilling responded, but not dramatically. The U.S. oil rig count rose from 407 at the end of February to 455 last week, an increase of 48 rigs, or about 12%. That is meaningful, but hardly the drilling boom we might have expected historically from oil approaching $100.
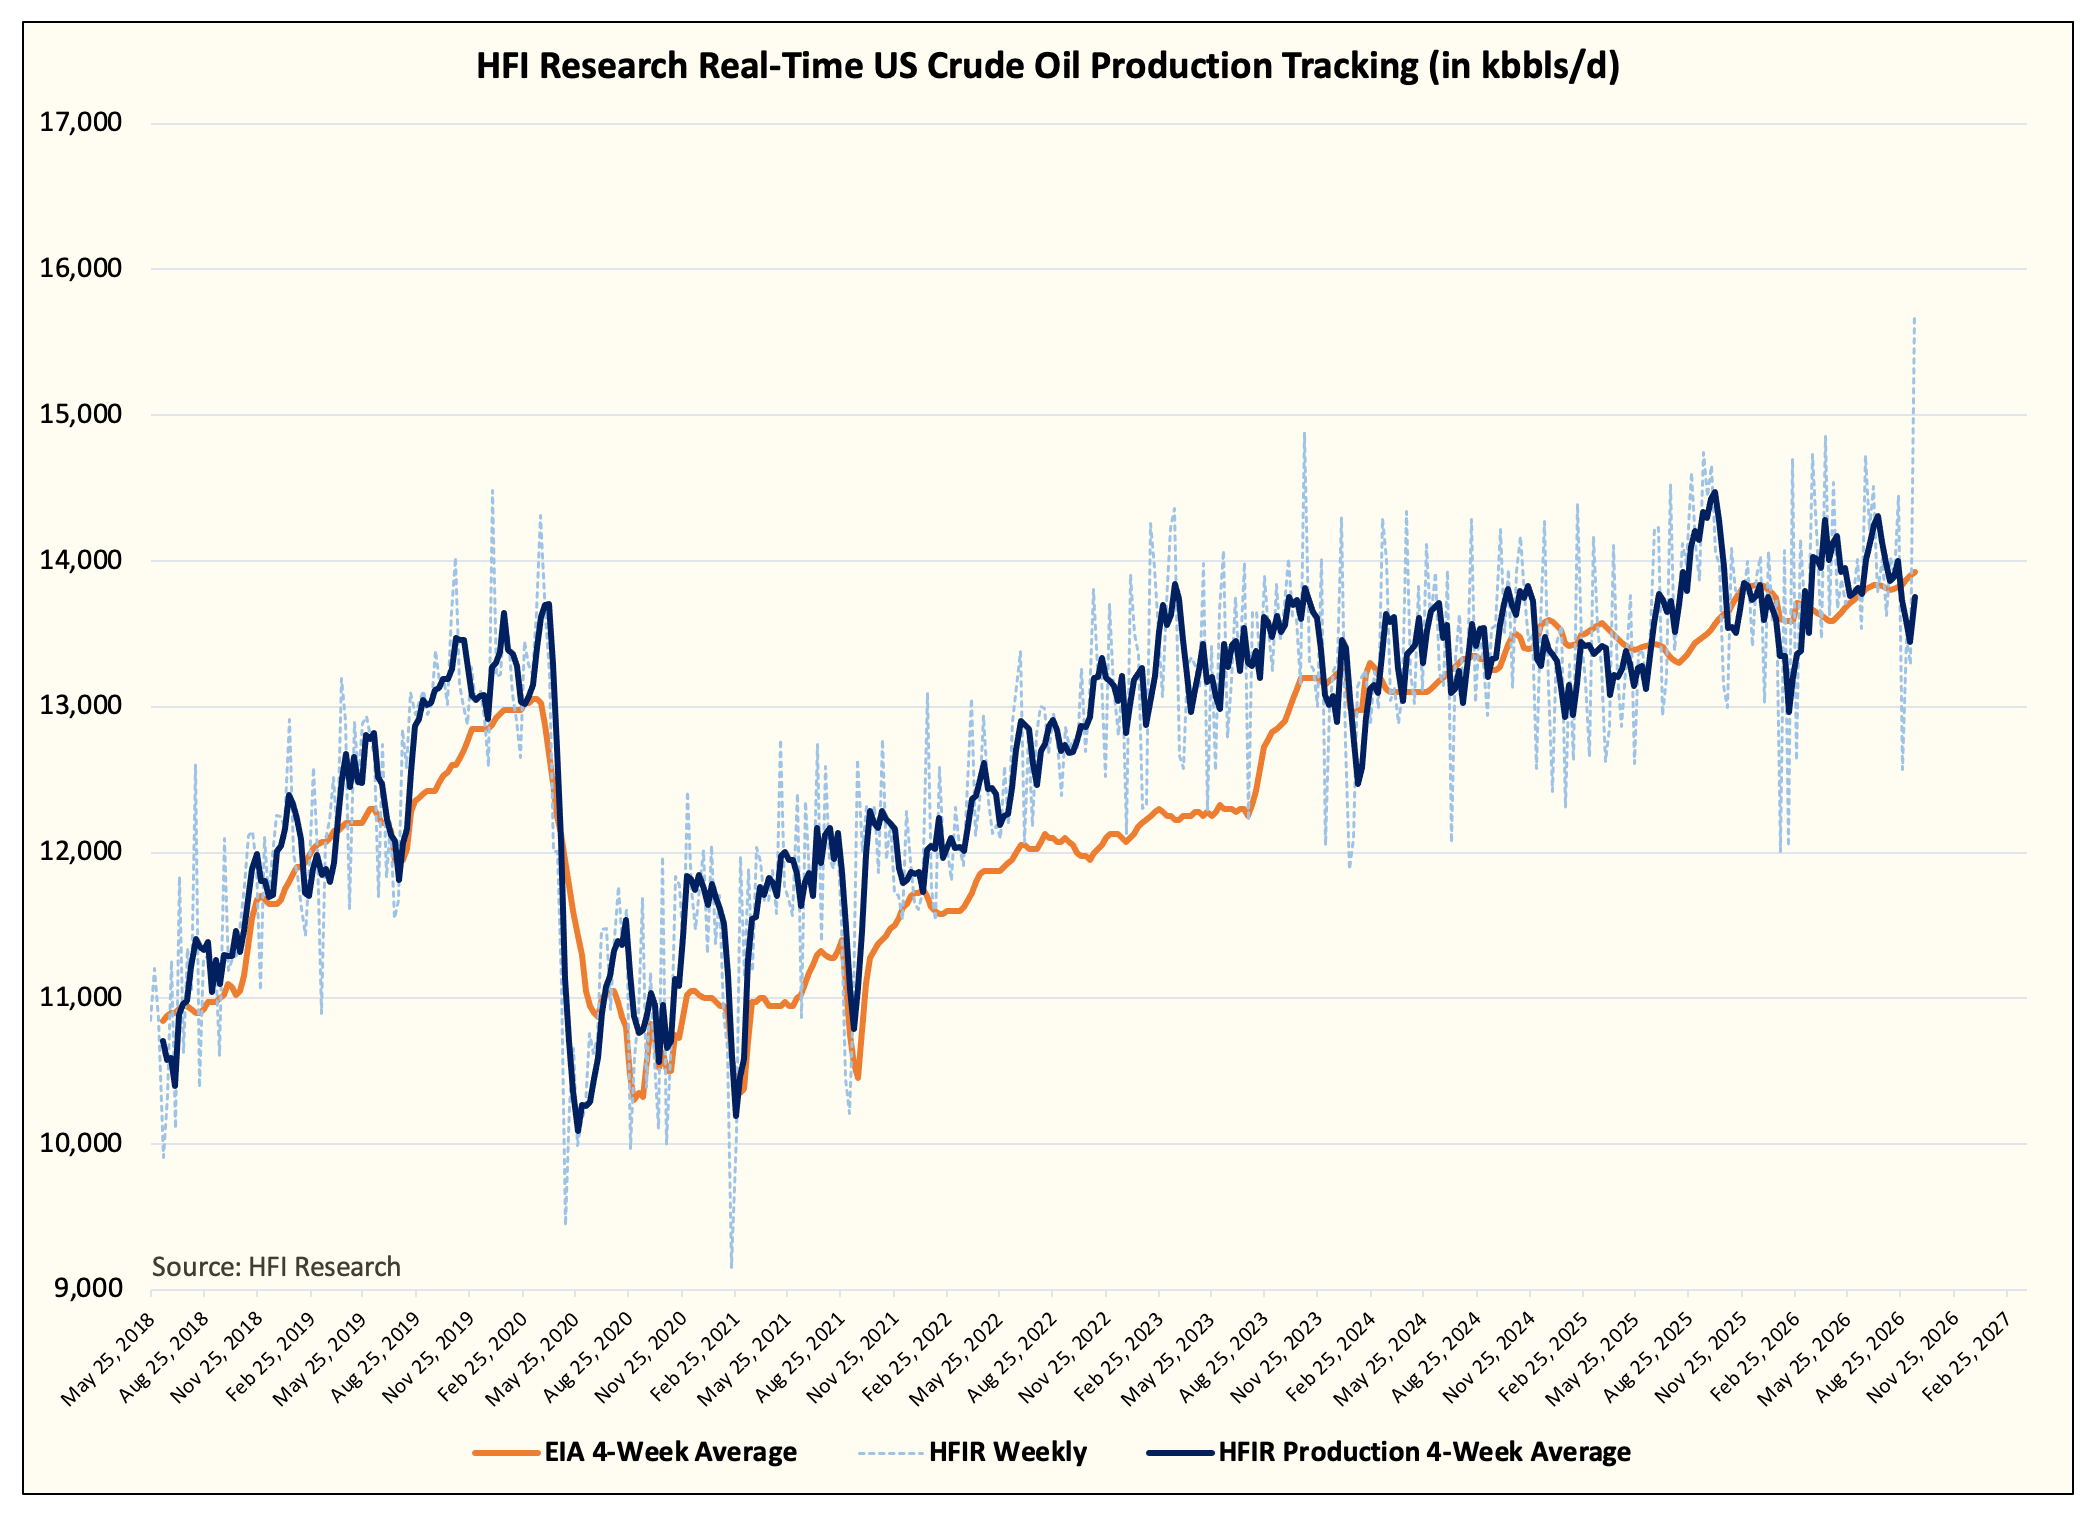
Official production data run only through June, so it is still too early for a verdict. June production was 13.79 million barrels per day, compared with 13.73 million in March. HFI Research’s real-time production tracking, which has been a useful leading indicator, shows production creeping higher since then, but not by anything approaching what we might have expected after a roughly 50% increase in WTI.
Producers Are Sending Us a Message
One explanation is that producers simply do not believe today’s prices will last.
The futures curve is a notoriously poor predictor of where oil prices will actually trade. But producers need a basis for planning, and in the absence of a reliable forecast, it becomes a de facto reference point. It also determines the prices at which they can hedge future production.
On September 24, WTI for December 2027 delivery traded at $73.72 per barrel, compared with $94.61 for delivery this November. Producers therefore have little reason to assume that $90 to $100 oil will persist over the life of a new well.
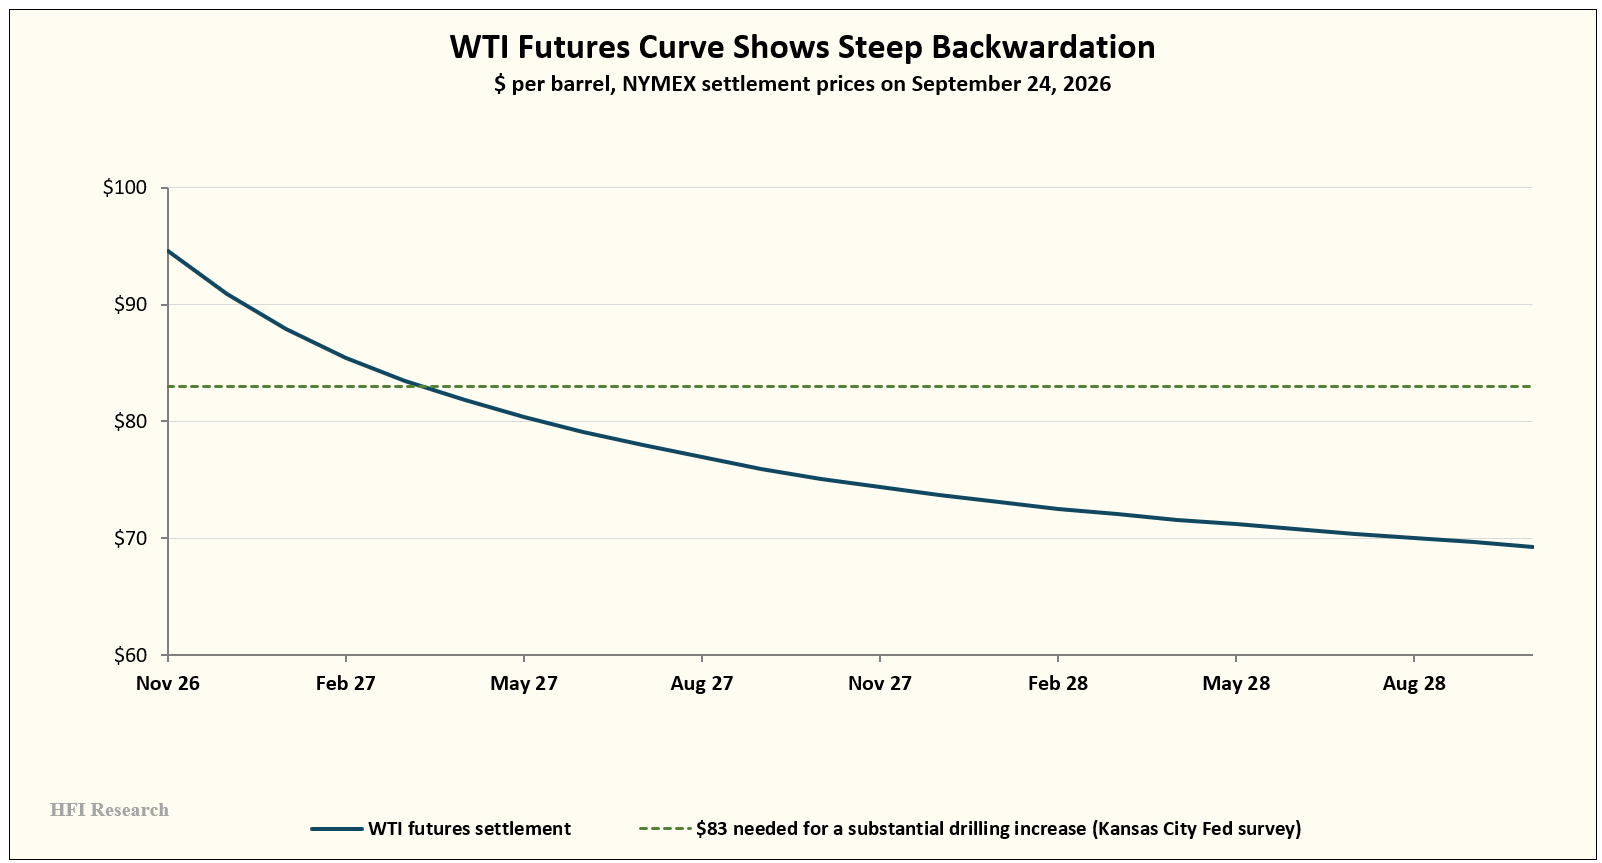
The Kansas City Fed found the same skepticism. Producers surveyed in July said they needed WTI of about $83 per barrel to justify a substantial increase in drilling, yet expected only $75 six months later.
The industry itself may also have changed. Consolidation has shifted more production into larger companies focused on capital discipline and shareholder returns. Producers have also been steadily consuming their best drilling inventory, leaving fewer of their most prolific and profitable locations.
It’s Now or Never
I am less interested in whether production rises than in how much.
After U.S. production bottomed in September 2016, it increased by about 0.6 million barrels per day over the following six months and by nearly 1 million over the next year, even though WTI averaged only about $49 per barrel. Oil has averaged more than $80 every month since March. A comparable response from today’s roughly 13.8 million barrels per day would put production near 14.4 million by next spring.
If production is moving toward that level, shale will have shown it can still respond to higher prices. If it remains near last October’s record of just under 14.0 million barrels per day around year-end, I think we should begin changing how we think about the U.S. oil industry. The EIA’s own forecast, about 14.0 million barrels per day in the fourth quarter and 14.3 million on average next year, falls short of that pace.
A much later drilling response looks less likely. The oil rig count reached 452 in mid-July and has remained between 447 and 455 since, despite WTI averaging more than $80 every month. Much of the production we will see through early next year is therefore being drilled now. If oil falls toward the low $70s next year, producers that added relatively few rigs at $100 are unlikely to become more aggressive.
What It Would Mean for the Oil Market
U.S. crude production rose from 5.5 million barrels per day in 2010 to 13.7 million last year, an increase unmatched by any other country. Shale became the world’s most important source of incremental oil supply because higher prices could bring additional barrels to market relatively quickly.
A world in which that mechanism becomes materially less responsive is a different oil market.
Brazil, Guyana and Canada will continue adding supply. The EIA expects the three to add roughly 0.4 million barrels per day next year. OPEC also retains spare capacity, although nearly all of it is currently stranded behind the closed Strait of Hormuz. EIA expects about 2.4 million barrels per day of spare capacity to be available once flows normalize, compared with about 3.0 million at the end of 2025.
If global demand eventually resumes growing by roughly one million barrels per day annually while U.S. production adds little, the call on those remaining sources rises quickly. On static assumptions, the 0.6 million barrels per day not covered by Brazil, Guyana and Canada each year would absorb a 2.4-million-barrel-per-day cushion in about four years. Of course, reality will not be that neat—demand, capacity and production elsewhere will change—but the arithmetic shows how much more dependent the market would become on OPEC without continued U.S. growth.
The path would not be smooth. A reopened Strait of Hormuz could send oil prices sharply lower next year, and a recession would reduce demand. But over a period of multiple years, slower U.S. production growth would leave the market with a smaller margin for error. Outside OPEC, no other source combines the scale and short-cycle responsiveness that U.S. shale brought to the market over the past decade.
Of course, I could be wrong. In 2022, the oil rig count rose only about 20%, yet U.S. production increased by 1.8 million barrels per day over the following 21 months as producers extracted more oil from each rig. If production is moving toward 14.4 million barrels per day by next spring, I will have significantly underestimated shale.
For our HFIR Energy Income portfolio, a weak shale response would strengthen the multi-year case for the energy businesses we own. By contrast, a strong response would leave us relying more on each company’s own merits rather than a structurally tighter oil market.
Six months ago, the market gave U.S. producers an unusually strong incentive to drill. Now we get to see how much oil they can deliver.
Link to HFIR Energy Income Portfolio on RunPlutus.
Analyst’s Disclosure: I/we have a beneficial long position in the shares of the HFI Research Energy Income Portfolio either through stock ownership, options, or other derivatives.