
The Strait Of Hormuz Disruption - Oil Supply Math Points To A Longer Crisis Than The Market Expects


By: Jon Costello
There is clearly no shortage of Hormuz commentary right now. In making my own contribution, I feel a bit like the author of a self-help book who has to justify his addition to an already oversaturated genre. What I can offer is an article focused on supply math. Most commentary focuses on the geopolitics, such as who said what, which side might blink first, or what an off-ramp might look like. Many fall into the trap of estimating resolution timelines and then pricing backward from that assumption. In this article, I examine the physical market disruptions and their implications for oil and refined product prices.
What becomes obvious is that the market is too complacent about the Strait of Hormuz.
This is not a geopolitical call; rather, it’s implied by the supply math. Regardless of the diplomatic signaling of the moment, the physical supply deficit and logistical realities dictate that this disruption extends through April at minimum, with the likelihood of refined product shortages the longer it persists. Such shortages increase the risk of price spikes, which in turn reduce end-user demand.
At present, I believe the contrarian move is to exercise caution amid what I view as heightened risk. This appears to me to be the best course. Investors should consider adopting a more defensive posture with at least a portion of their portfolio in the event that conditions deteriorate from here. They should be careful not to concentrate too heavily in stocks that require economic growth or low interest rates to support their prices. Defensive positioning can help mitigate the adverse financial and psychological impact of a prolonged energy crisis.
The Supply Deficit Is Larger Than the Headlines Suggest
Before the current disruption, the Strait of Hormuz carried approximately 20 million barrels per day of total petroleum liquids, equivalent to roughly 20% of global petroleum liquids consumption, according to the EIA. Real-time physical market tracking by commodities and shipping trackers puts the supply outage figure at 12.5 to 13.0 million barrels per day (bpd). I am using 12 million bpd as my anchor for this analysis.
Going country by country, the damage is severe. The key question relates to how much of the crude that cannot pass through the Strait has other outlets. From there, it is possible to estimate the net supply outages.
Saudi Arabia cannot export oil through the Strait, so it activated its East-West Pipeline, which carries a 7 million bpd nameplate capacity. However, the headline 7 million bpd figure overstates the amount that actually reaches the export market. Consider that approximately 1.5 million bpd of the 7 million bpd had already been flowing to feed two refineries that serve domestic Saudi consumption. Another 500,000 bpd of capacity is dedicated to LPG, a product stream with more limited uses as a refinery feedstock than crude oil. This implies a ceiling of incremental crude oil supply from the East-West pipeline of not 7 million bpd, but 5 million bpd. And the figure falls even further upon closer inspection. The East-West pipeline feeds the Yanbu Port on the Red Sea, where nominal loading capacity is 4.5 million bpd but tested capacity is closer to 4 million bpd. In wartime, throughput falls due to loading constraints. During wartime, Very Large Crude Carrier (VLCC) tankers loading crude at the Yanbu Port are required to sail during the day to avoid the hazards of nighttime travel and attacks by the Houthis. This travel constraint limits the number of vessels that can load crude at a given time, reducing export capacity from 4 million bpd to 3 to 3.5 million bpd. As a result, the headline of 7 million bpd of Saudi exports falls by half to 3.5 million bpd. Saudi Arabia is therefore capable of offsetting roughly 29% of the 12 million bpd of supply outages.
Iraq, the second-largest exporter through the Strait of Hormuz, has been devastated. Basra oil output has fallen by 76% to just 800,000 bpd from a pre-crisis level of 3.3 million bpd in exports. More production cuts are expected over the coming days if the Strait remains closed to Iraqi exports. The country declared force majeure on all foreign-operated fields on March 20 and is working to revive the Kirkuk-Ceyhan pipeline to Turkey, but the volumes are insignificant in the context of total Iraqi production losses. The pipeline is currently flowing approximately 250,000 bpd and will presumably reach full capacity of 500,000 bpd, at which point it will add 250,000 bpd of additional production, equivalent to 7% of Iraq’s total supply outages. Years of disrepair and underinvestment suggest the pipeline isn’t likely to achieve its 1.6 million bpd design capacity for several years. Certain Iraqi fields face the additional challenge that extended shutdowns increase the risk of geological and well damage. And to top it off, Iraq derives 90% of its government’s revenue from oil, so it faces a financial crisis on top of an energy crisis that will likely compound the supply disruption.
Kuwait is the most vulnerable Gulf producer. It has no bypass pipelines whatsoever. Every barrel of Kuwait’s 2.6 million bpd of production must transit Hormuz. The country has reportedly cut its production from 2.6 million bpd to just 500,000 bpd. The CEO of Kuwait Petroleum Corp. recently stated that it will take 3 to 4 months to fully restore the bulk of Kuwait’s production.
The UAE has the only other bypass pipeline outside Saudi Arabia. However, its ADCOP line from Habshan to Fujairah has only 440,000 bpd of spare capacity, a rounding error against the ongoing 12 million bpd supply deficit. Physical infrastructure damage at Fujairah and the Ruwais refinery, which was shut after a drone strike on March 10, further constrains even this limited workaround.
Altogether, Saudi Arabia, Kuwait, and the UAE have alternative pipeline capacity amounting to roughly 4 million bpd, representing one-third of the 12 million bpd of total supply outage. The remaining 8 million bpd must be sourced from Atlantic basin alternatives with 20-to-40-day sailing times. That represents roughly two-thirds of the total disruption with no near-term fix.
Recall that oil prices surged past $140 per barrel after Russia invaded Ukraine. At the time, the oil market expected the loss of 3 million bpd, which never actually materialized. Today, the market has been running an 8 million unresolved supply deficit for weeks. I find it amazing that Brent sits only slightly above $100 per barrel.
The SPR Is a Bandage, Not a Fix
Each successive SPR headline has had less market impact, and the math explains why. The entire coordinated global release of 400 million barrels across 32 nations amounts to roughly 4 days of global oil consumption. The U.S. contribution of 172 million barrels over 120 days implies a flow rate of 1.43 million bpd, covering just 12% of the approximately 12 million bpd that has been shut in. The U.S. SPR was at 415 million barrels before the release, roughly 58% to 60% of its 714-million-barrel capacity and not far above the 347-million-barrel historical low reached in 2023.
Note that by the fifth SPR announcement, oil prices didn’t react and then moved higher. The market has learned to discount SPR headlines because the volumes don’t move the needle against a disruption of this magnitude.
Crack Spreads Point to Physical Market Tightness
The refined product picture is also characterized by severe supply outages. The recent surge in crack spreads—the difference between the price of a refined product and the price of the crude used to produce it—puts them in reach of highs last seen after Russia invaded Ukraine.
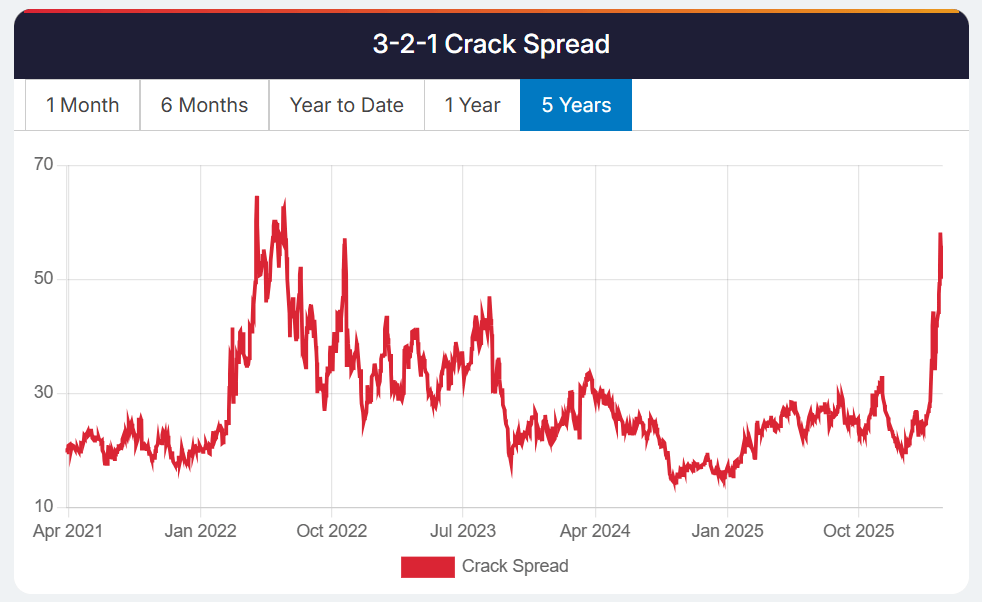
Source: RBN Energy, March 26, 2026.
The gasoline crack is approximately $28 per barrel. The diesel crack has widened to $0.84 per gallon, 61% above 2024 levels. Jet fuel in Singapore has hit $227 per barrel. These margins provide refineries with a strong incentive to buy crude and run it. They imply that refining can remain profitable up to roughly $130 per barrel Brent. As long as that’s the case, crude demand from the refining sector stays firm even at elevated prices, which puts a floor under the physical market.
Refined Products: The Amplifier
The crude oil deficit is being compounded by a refined product squeeze that many investors fail to appreciate. On March 4, China banned all exports of gasoline, diesel, and aviation fuel via an order from the NDRC. Most of the world’s spare refining capacity resides in China. Its more than 19 million bpd of capacity versus its approximately 15 million bpd of refinery throughput, giving it significant excess production capacity and making its role in refined products analogous to Saudi Arabia’s role as the largest source of crude oil spare production capacity. By banning exports, China removed the single largest buffer for Asia-Pacific refined product supply. This has arguably been the most consequential policy decision of the crisis after the closure of the Strait itself.
After China’s move, South Korea has capped fuel exports, mandating that 90% of prior-year domestic volumes must be maintained before any exports are permitted.
Now, Australia is the canary in the coal mine. The days of remaining fuel supply have collapsed from 30 to 38 days before the crisis, to the point that more than 600 gas stations have run dry on at least one fuel type. In March, Australia imported 240,000 metric tons of U.S. fuel, the most in more than 30 years.
The situation is growing more acute elsewhere in Asia. Jet fuel in Singapore has surged to $227 per barrel from a pre-war baseline of $80 to $90 per barrel, while naphtha prices have jumped approximately 50% over the past month. VietJet has cancelled large-scale international routes, Air India has imposed surcharges, the Philippines has declared a state of national energy emergency, and Myanmar has imposed alternating driving days. These are not speculative outcomes. They are happening now.
The hoarding dynamic represents the tail risk that could push prices much higher. If more countries follow China and South Korea in restricting exports, or if the U.S. imposes any form of export restriction ahead of driving season, a 1970s-style panic-buying dynamic may take hold.