Editor’s Note: This article was first published to paying subscribers on August 9, 2024. Please consider becoming a paid subscriber to get exclusive write-ups like this one!
Suncor Energy (SU:CA) shares have been flat since we last analyzed the name when it released first-quarter results. While Suncor’s market value may not have changed, we like its shares considerably more than we did three months ago.
Our enthusiasm stems from our conviction that Suncor’s operational and financial turnaround is sustainable. Second-quarter results revealed a changed company. Management is firmly in control of operations. Volumes are up while costs are down. The company’s integrated business model is generating above-average returns on capital. We expect all these improvements to last and to grow value for shareholders for years into the future.
A Standout Q2 Performance
In the second quarter, Suncor beat expectations on nearly every key metric. So far this year, its results have exceeded the high end of management’s guidance range in areas ranging from upstream production volumes to refinery throughput to refined product sales. It achieved this despite a heavy maintenance schedule that reduced volumes in its Base Upgrader, Syncrude facility, Montreal refinery, and Sarnia refinery. In aggregate, the turnarounds reduced quarterly production by approximately 60,000 bbl/d.
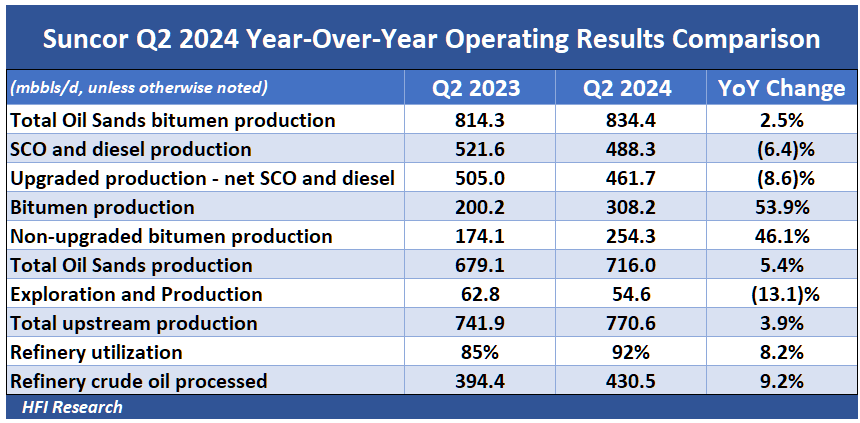
Even with these headwinds, results improved significantly, as illustrated in the quarter’s operating highlights below.
Of note is the 53.9% increase in bitumen production, which was partly attributable to Suncor’s November 2023 acquisition of the 31.2% ownership stake in its Fort Hills bitumen operation that it didn’t already own. Also, lower upgraded Syncrude production during the quarter was due to a decline in upgrader utilization, which was reduced to 86% versus 92% in the year-ago quarter due to planned turnarounds.
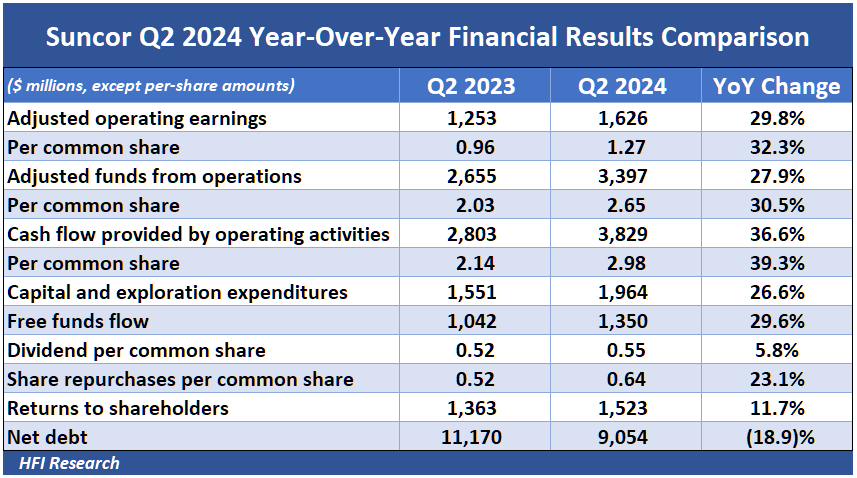
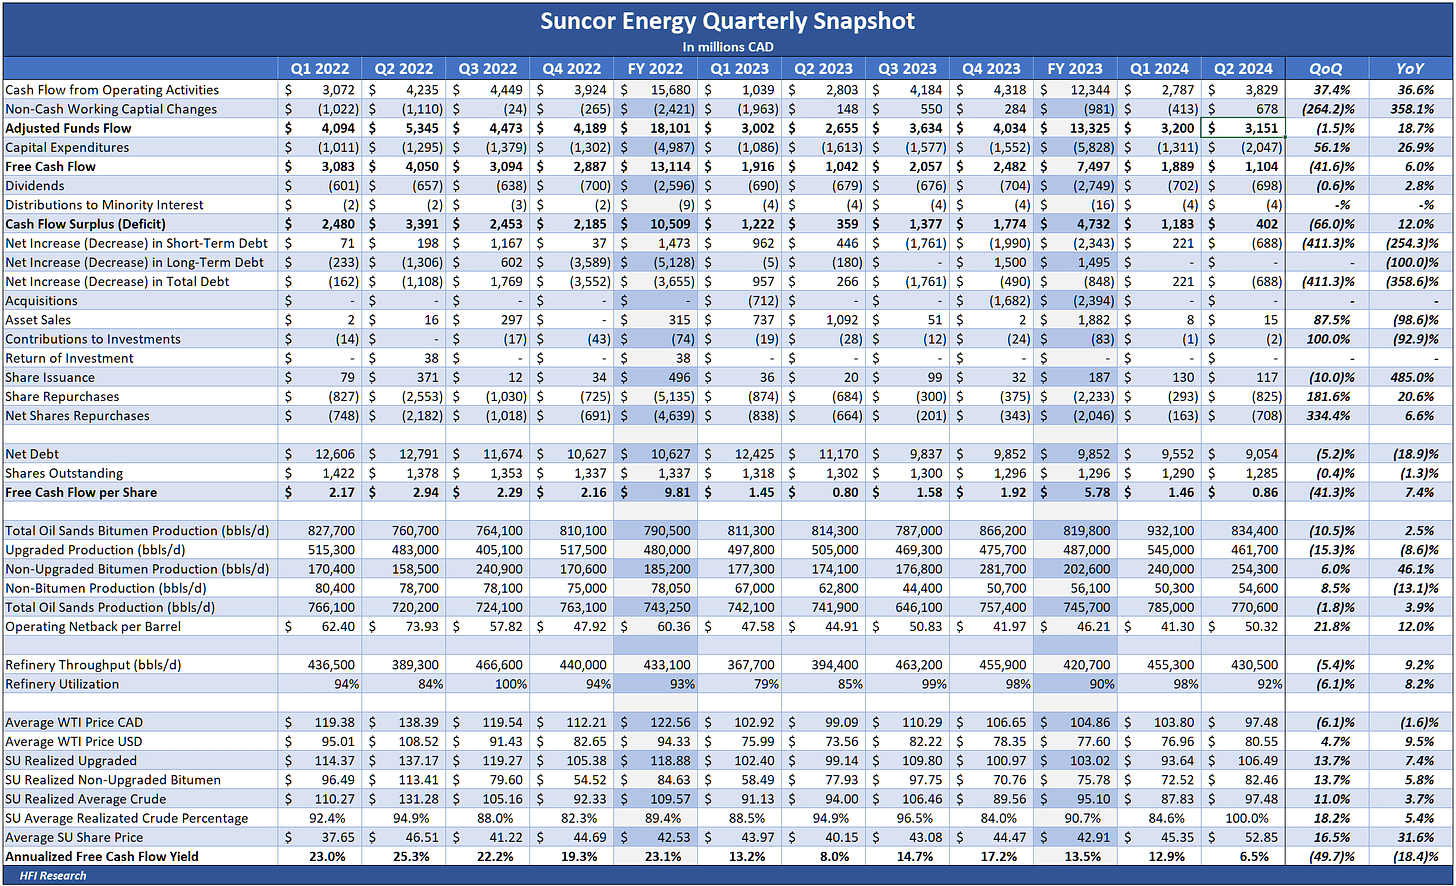
Suncor’s operational performance drove a spectacular financial performance during the quarter, as shown below.
In the second quarter, turnaround activity consumed $800 million of capex, reducing free cash flow by the same amount. Despite such a large cash flow headwind, the company managed to pay down long-term debt, repurchase shares, and pay a base dividend at levels consistent with previous quarters.
Operating Leverage is Growing
Management is squarely focused on increasing Suncor’s operating leverage through the combination of higher production volumes and lower unit costs.
The volume performance was enhanced by greater operational reliability and increased asset utilization. The quarter’s efficient turnaround activity provides a case in point. The turnarounds were 10% shorter this year than last year. The shorter length resulted in eight additional days of downstream throughput and 12 days of upstream production.
Cost performance was particularly impressive. The company invested in 55 new 400-ton mining trucks and autonomous mining trucks that boost efficiency, thereby reducing costs and lowering Suncor’s breakeven cost by $475 million.
Suncor shareholders are able to see the tangible steps management is taking to enhance operational efficiency and drive higher cash flow per share. These measures have increased Suncor’s production on a sustainable basis and reduced its unit costs. In doing so, they have reduced the company’s breakeven cost per barrel while increasing its cash flow upside amid higher oil prices. The result is increasing shareholder value.
Strong Operating Performance Drives Financial Outperformance
The company’s outperformance in the second quarter starts with production growth. Total upstream volumes came in at 770,600 bbl/d, beating consensus expectations of 734,000 bbl/d by 36,600 bbl/d, or 5%.
Oil sands production volumes increased by 11%, driven by record Firebag volumes. Oil sands operating costs declined by 6%.
Bitumen production at Fort Hills hit a record and achieved a 7% reduction in operating costs. Syncrude production, meanwhile, outperformed expectations and saw operating costs decline by 5%. Oil sands adjusted funds from operations totaled $3.1 billion, versus $2.6 billion in the year-ago quarter.
Both upgraded and non-upgraded bitumen production held up well relative to previous periods despite the intensity of the turnarounds during the quarter.
Offshore production volumes increased by 1% during the quarter and contributed $398 million in adjusted funds from operations.
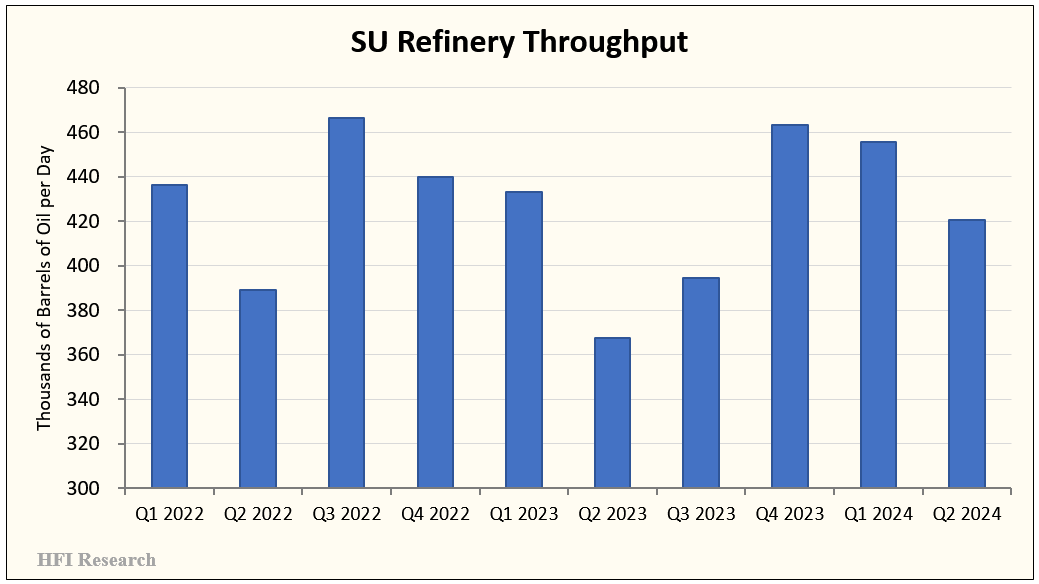
Downstream, Suncor generated $893 million of adjusted funds from operations. Segment utilization was 92% on 430,500 bbl/d of throughput. The flagship Edmonton refinery achieved record utilization of 108%. After maintenance was completed in May, downstream ran at more than 100% utilization in June and July.
Second-quarter refinery throughput should be compared against the second quarter of previous years. Throughput can be seen outperfoming in the following chart.
Superb Capital Allocation Continues
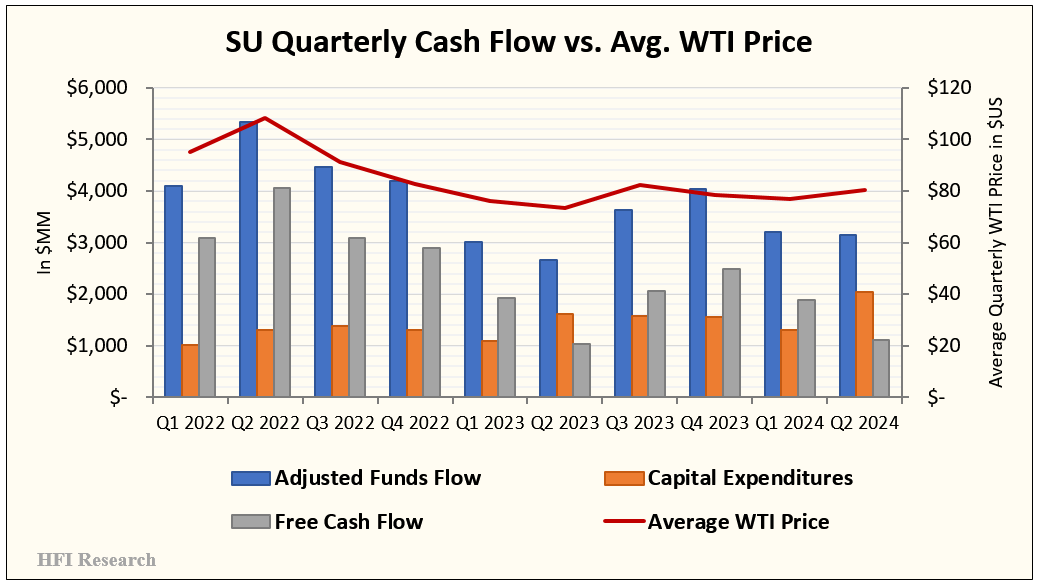
Suncor’s free cash flow in the second quarter came in at $1.1 billion versus $1.0 billion in the year-ago quarter. Free cash flow was low relative to previous quarters due to the $800 million allocated to fund turnarounds.
The chart below illustrates the higher capex relative to previous quarters and its impact on reducing free cash flow.
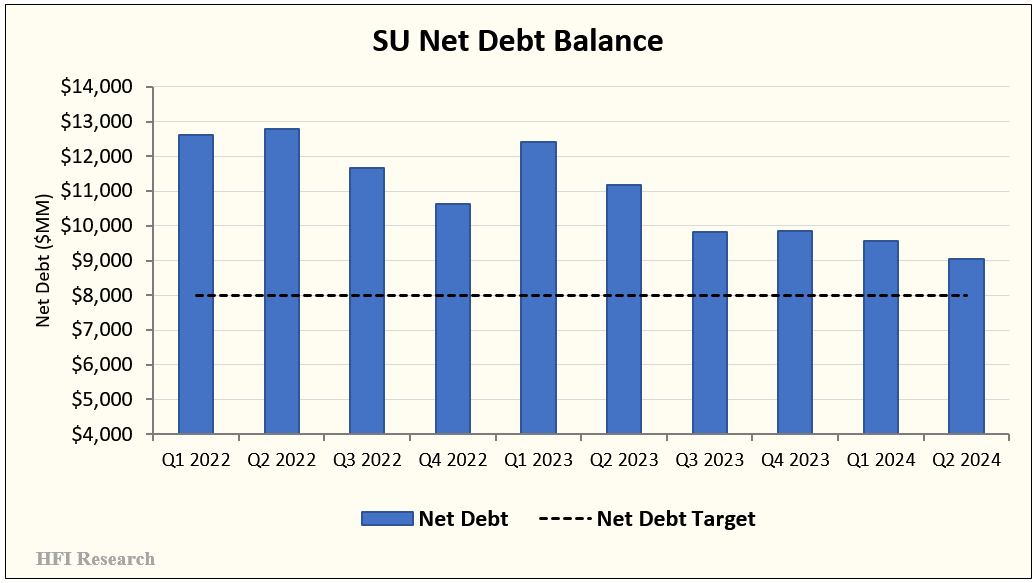
During the quarter, Suncor used a $678 million working capital draw to fund $489 million of debt reduction. Its net debt balance crept closer to its $8 billion net debt target, at which point it intends to pivot from distributing 75% of free cash flow to shareholders to 100%.
The working capital draw allowed the company to pay down net debt while using the reduced free cash flow to keep dividends and share repurchases consistent with previous quarters when WTI averaged in the low-$US80s per barrel range.
Suncor spent $825 million to purchase 15.6 million shares at an average price of $52.88. Repurchases caused shares outstanding to continue their steady decline, as shown below.
We expect Suncor’s share count to fall lower unless the share price exceeds $65, at which point we suspect the company will opt to distribute free cash flow via a base dividend and variable quarterly dividends.
The progressively lower share count shrinks the gross amount of cash flow required to pay dividends, making an increase in the base dividend more likely. If Suncor’s share price remains low relative to value, we expect share repurchases to have a material impact on free cash flow generation potential on a per-share basis.
It paid $698 million in dividends. The $2.18 per share annualized yield is equivalent to a safe and attractive 4.0% dividend yield.
Improvements are Sustainable
Second-quarter results confirm to us that the company’s outperformance over the previous quarters wasn’t a fluke. Suncor has emerged as a company changed for the better, and we believe its shareholders are poised to benefit from the change for many years into the future.
Not only is Suncor’s execution outstanding, but its strategy of integrating upstream and downstream can be a powerful model. The combined entity generates a return on capital employed of 15.6%, above average for any E&P operation. We’re still waiting to see something similar from Suncor’s integrated peer, Cenovus Energy (CVE:CA).
Suncor’s fully integrated model also renders it immune to the volatility in the WTI-WCS differential. Investors in the Canadian oil patch have been frustrated that the differential has recently widened back to the mid-teens per barrel, above the long-term level they expected after the Trans Mountain Expansion came online. Suncor shareholders can disregard these concerns and take comfort in the fact that the company’s business model will allow it to realize sustainably higher prices relative to peers. Over time, the shares could be rewarded with a higher multiple, as they had been in 2018 and earlier.
Management hinted that it would hit its $8 billion net debt target approximately six months sooner than its guidance for mid-year 2025. Barring a dramatic selloff in the oil price, we now expect it to reach the target by year-end. Suncor would then join Imperial Oil (IMO:CA), Athabasca Oil (ATH:CA), Canadian Natural Resources (CNQ:CA), Cenovus Energy, and MEG Energy (MEG:CA) in achieving the pivot to 100% payout of free cash flow to shareholders.
Suncor has also clearly turned the corner with regard to its safety record, which was among the worst in the industry before current management took over. It has not experienced a fatality under present management.
We see little long-term fundamental downside in Suncor shares at their current price. In the short term, shareholders should be aware that management expects lower upstream production volumes in the second half of the year as the Fort Hills mine opens up another pit and as maintenance continues at the Base Plant. However, management beat first-half expectations in large part by running Firebag in-situ production at a level that exceeded its long-term nameplate capacity. Management could pull off something similar to beat expectations in the second half.
Valuation
Suncor’s management has clearly articulated its goals for 2026. Given the success it has had turning Suncor around, as well as the momentum the company now has in operating and financial improvement, we expect management to achieve its goals.
We therefore feel more comfortable projecting the company’s results out to 2026. We now expect lower costs than we had expected in our last valuation. We also expect 2026 production to be 2.0% higher—at approximately 860,000 bbl/d—than our earlier assumption.
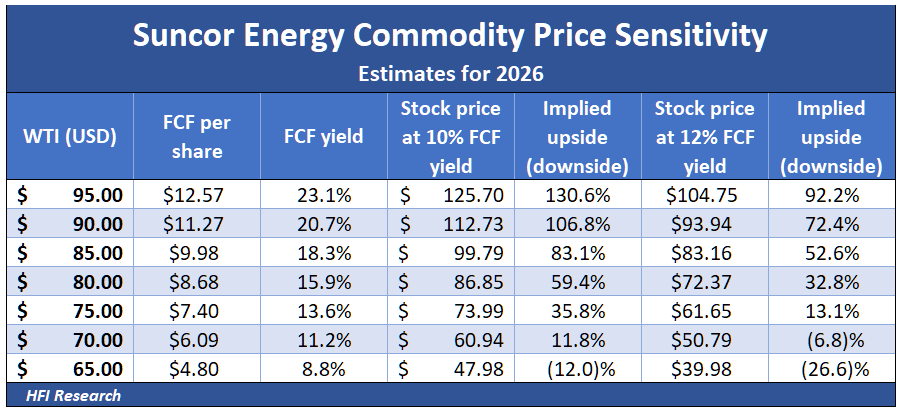
Our new estimates result in the following free cash flow generation at different oil prices.
If we apply a 25% probability to WTI at US$70, US$75, US$80, and US$85 per barrel, we estimate a share value of $67.00, 23% higher than the current share price of $54.50.
We believe our valuation is conservative, as we expect WTI to trade at a higher price than the US$77.50 per barrel average our valuation assumes. Due to the company’s enhanced cash flow torque, we estimate that its value per share based on a 12% free cash flow yield grows to $83.16 with WTI at US$85 per barrel, implying 52.6% upside. We consider this sort of upside achievable after 2026.
Suncor shares are also cheap based on relative debt-adjusted cash flow multiples. Its shares currently trade at a debt-adjusted cash flow multiple of 4.6-times. Given the likelihood that its positive results continue, this multiple is too low. It’s only slightly higher than that of Cenovus Energy, which trades at a 4.3-times multiple as it continues to struggle with operational issues. Canadian Natural Resources (CNQ:CA), the star performer of the Canadian oil sands, meanwhile, trades at a lofty 7.3-times debt-adjusted cash flow.
The results are similar based on our expectation for free cash flow yield based on US$80 per barrel WTI. Suncor shares currently trade at an 11.1% free cash flow yield versus 11.8% for CVE and 8.0% for CNQ. Suncor’s higher cash flow over the next two years and/or free cash flow yield compression are likely to drive its share price higher.
Conclusion
Suncor shareholders get the benefit of owning an emerging blue-chip E&P that is still priced like the perennial underperformer it used to be. Over the coming years, they stand to benefit from massive dividend payments and share repurchases. Furthermore, we expect the shares’ valuation multiple to increase to reflect the company’s unusually attractive economics.
With so much to like, we believe the message of Suncor’s second-quarter results is clear: its shares are a buy.
Analyst's Disclosure: I/we have a beneficial long position in the shares of SU, CVE, MEG.TO, ATH.TO either through stock ownership, options, or other derivatives.


