

By: Jon Costello
I’ve been thinking a lot about how to position and when—or even if—to sell oil-related holdings after their surge in response to the conflict in Iran. Aside from investing a portion of the distributions received, the HFIR Energy Income Portfolio has had no trading activity over the past 15 months. But its daily performance looks like this:
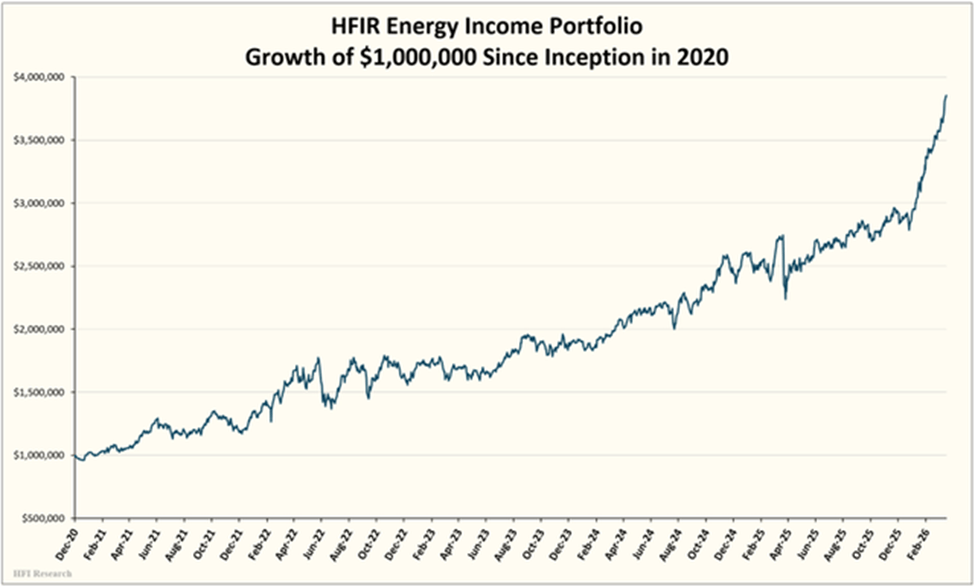
I’d be crazy not to consider trimming after such a rapid surge in the portfolio. The trick, as always, lies in the timing.
Physical Fundamentals Justify the Premium
Since the U.S.-Israeli strikes on Iranian nuclear and military infrastructure began on February 28, Brent crude has surged from roughly $80 per barrel to over $112, or more than 50% in a single month. On Monday, March 30, WTI settled above $100 for the first time since July 2022. The IEA and other experts have characterized the disruption to flows through the Strait of Hormuz as the largest supply disruption in the history of the global oil market.
The risk premium on crude oil is no longer based mostly on market anticipation. Iran’s Islamic Revolutionary Guard Corps closed the Strait to most commercial shipping on March 4. A selective reopening on March 26 now permits transit for ships flagged to five nations, namely China, Russia, India, Iraq, and Pakistan, but the net reduction in flows is estimated at roughly 11 million barrels per day. For context, that strait normally handles approximately 21 million barrels per day, or about 20% of global petroleum liquids consumption.
Energy equities have followed the surge in oil. The XLE is up approximately 40% year-to-date through March, outperforming the S&P 500 by over 32 percentage points. This is the widest gap ever recorded in a single quarter. Fourteen of the 22 XLE constituents rallied more than 10% in March alone.
The instinctive conclusion is straightforward: higher oil prices justify higher equity valuations, and the disruption is real this time. But looking at history, I’m more inclined to believe that some de-risking may be in order.
The Pattern That Repeats: War Premiums Collapse
The risk, as I see it, for holders of energy equities arises due to the historical pattern of collapsing risk premiums once supply risks fade. The pattern is for oil prices to peak at maximum uncertainty, not necessarily maximum disruption. Prices then collapse once markets realize the worst-case scenario either will not materialize or has already been priced in.
Historical analogs follow a similar pattern.
Gulf War, from 1990 to 1991. Iraq’s invasion of Kuwait drove oil prices sharply higher as markets priced in a prolonged supply shock. Once it became clear that a U.S.-led coalition would restore flows, oil collapsed before the conflict itself had fully resolved. The peak occurred when fear was highest, not when fundamentals were most impaired.
Libya in 2011. The civil war removed roughly 1.5 million barrels per day from global supply. This was an actual, physical disruption, and prices spiked accordingly. Yet Saudi spare capacity and global supply adjustments filled the gap faster than expected, and the rally faded.
Russia-Ukraine in 2022. This is perhaps the most relevant recent analog prior to today. Oil surged above $120 per barrel amid fears of massive, sustained supply losses from one of the world’s largest exporters. Those fears proved to be dramatically overstated. Russian barrels were rerouted, demand adjusted, and oil prices declined even as the war continued. Markets consistently overestimated the persistence of disruption.
These episodes reflect a structural feature of the oil market. Markets tend to discount probabilities. The oil market has tended to embed worst-case scenarios into prices early on, leaving limited room for further upside. Historically, supply has generally been more flexible than assumed, adjusting to disruptions through spare capacity, inventory drawdowns, and rerouting. Meanwhile, higher prices reduce consumption, particularly in emerging markets, while speculative positioning amplifies both the rally and the inevitable unwind.
In all these previous episodes, the geopolitical risk premium was not a stable component of oil prices. It was a temporary overlay that disappeared abruptly once uncertainty abated.
This Episode Breaks the Historical Mold
Today’s disruption differs from previous episodes in important ways, with important implications for portfolio positioning.
First, this is a chokepoint disruption, not a producer outage. Past disruptions, such as those involving supply losses in Libya, Iraq, and even Russia, also led to production losses. In those situations, the global system had enough spare capacity to offset the production losses.
By contrast, the Strait of Hormuz is a transit artery. Disruption here affects flow, not just supply, and rerouting is far more complex. There is no pipeline bypass for 21 million barrels per day of seaborne crude, condensate, and refined products.
Second, the disruption has actually materialized. In previous episodes, markets priced for a disruption that never fully occurred. Here, the Strait was physically closed for weeks, and the selective reopening excludes most Western-allied shipping. The 11 million barrels per day net reduction dwarfs the scale of previous disruptions. This is not a risk premium on a theoretical anticipated threat, but a premium on an ongoing event.
Third, the system’s shock absorbers are weaker. Before this disruption, OPEC’s deployable spare capacity stood at 1.5 to 2.5 million barrels per day. This spare capacity was concentrated almost entirely in Saudi Arabia and the UAE. This spare capacity represents a fraction of the volumes currently disrupted. More importantly, the strategic value of this spare capacity is diminished when low-cost drones can credibly threaten the infrastructure that produces it. The vulnerability of concentrated spare capacity in the Middle East to military threats is a structural shift the market has not fully priced in.
Consider further that U.S. shale production has plateaued at roughly 12.7 million barrels per day over the past several months. Capital discipline, depleting Tier-1 acreage, and muted drilling response mean the U.S. is no longer the swing supplier it was in the 2014 to 2019 timeframe. In fact, the EIA is forecasting a slight decline in U.S. output in 2026.
Fourth, escalation risk is nonlinear. Previous conflicts were localized events. By contrast, today’s situation involves direct military strikes on a major regional power, the killing of its leadership, and retaliatory missile and drone strikes on U.S. bases and allied Gulf states. Diplomatic efforts have thus far failed, with Iran rejecting a U.S. 15-point proposal on March 25 and its parliament stating it will not negotiate under coercion. The pathway from here includes infrastructure targeting, further shipping disruptions, and broader regional spillover.
Fifth, normalization takes longer than the market assumes. Even in a peace scenario, the physical process of restoring transit through the Hormuz Strait will be measured in months, not days. Empty vessels need to be repositioned into the Strait and then routed back to destination points. Safety buffers, such as unsanctioned oil-on-water and SPR draws, are being exhausted. Cumulative Middle Eastern production losses are projected to reach as much as 1 billion barrels even under an optimistic mid-April normalization, effectively killing the surplus narrative that had characterized pre-crisis balances. And restarting production from shut-in fields takes months. For instance, Kuwait has publicly stated that it expects its own fields to take 3 to 4 months to fully resume operations. Restarting production from less technologically sophisticated fields carries the risk of damaging reservoirs after a prolonged shutdown. Clearly, this massive global system of mindboggling complexity will not straighten itself out overnight.
Resolving the Tension: What the Outcomes Look Like
This is where I think investors risk making the wrong call. In moments of fear and uncertainty, there is a temptation to focus on binary outcomes and make binary trading decisions. Investors may opt to either stay fully invested, betting on continued escalation, or exit entirely, betting on historical precedent. Both approaches ignore the wider distribution of potential outcomes.
At the moment, several such outcomes strike me as likely.
Scenario A: Negotiated de-escalation within 60 to 90 days (40% to 50% probability). A diplomatic resolution or a sustained ceasefire leads to the reopening of the Strait. In this scenario, I would expect oil to decline, but not to pre-crisis levels. Even during de-escalation, the normalization of physical flows will take months, cumulative supply losses will have reset global balances, and an enduring political risk premium of $10 to $20 per barrel will likely persist in light of the Strait’s demonstrated vulnerability. Given all the factors at play to date, I expect Brent in the $80 to $90 per barrel range. At those prices, energy equities would give back a portion of their first-quarter gains but would find support above pre-crisis levels. This remains the most likely single outcome, but I’ve reduced its probability from my initial estimate because the normalization timeline alone, which includes months of vessel repositioning, field restarts, and stock rebuilding, will make a clean, rapid unwind unrealistic.
Scenario B: Prolonged partial disruption (35% to 45% probability). The selective reopening of the Strait persists. Some barrels flow, but at a higher cost and with insurance premiums. Oil stabilizes above $100 per barrel and at times heads toward $120 for several quarters. In this scenario, the likelihood of broader economic damage from the outage increases. Markets and stock prices would discount a weakening economy. Energy equities would likely hold their gains and trade sideways. This is the scenario markets are increasingly pricing in, and the one whose probability I’ve revised upward. The structural factors in play all support a more persistent disruption than historical analogs would suggest.
Scenario C: Full escalation and sustained closure (10% to 20% probability). The conflict widens, infrastructure is targeted, and the Strait returns to full closure. Oil is sustained above $130, which is the price at which I estimate demand curtailment will begin on a broader scale in more developed economies, which consume most of the world’s oil. Energy equities re-rate further before the global economy buckles under the strain of higher energy prices, at which point they would decline from their highs. This scenario represents the tail risk.
What to Do: Reduce Position Size, Not Exposure
The appropriate response is not to exit all energy investments in full. It is to de-risk while maintaining meaningful exposure. The key point is that, despite the structural arguments for a higher floor, current prices still reflect a premium that is at risk of rapidly diminishing. The historical pattern of overshoot remains intact, even if the downside in the current situation is less extreme.
I would recommend trimming overall energy equity exposure by approximately 10% to 15% at current levels. This is not a defensive retreat, but a recognition that the market is pricing a sustained disruption with limited margin for error. The objective is to reduce exposure to a potential normalization of the risk premium while retaining long-term participation in a structurally tighter market.
For energy specialists, holding cash seems prudent. I have already raised the HFIR Energy Income Portfolio’s cash position to 4%, and I’m considering increasing it to the 15% to 20% range. This cash can be deployed back into the energy sector in the event commodity and/or stock prices decline. Alternatively, it can be deployed more widely into other sectors if oil prices run away to the upside and the rest of the market declines.
What to Trim First
After deciding to de-risk, an investor must determine what to sell first. I would focus on names with the highest beta to spot oil prices. These stocks have rallied most aggressively and carry the most downside if oil corrects.
The first candidates for trimming are lower-quality E&Ps with high oil torque. Devon Energy (DVN) and APA Corporation (APA) are two such examples that come to mind. These are widely held stocks that have led the XLE, with a 44% gain in March alone. They are currently among the E&Ps most exposed to a risk premium unwind. These stocks have re-rated on pricing that may not persist.
Second, I would consider lightening up on integrated majors that have benefited from multiple expansion. Exxon Mobil (XOM) and Chevron (CVX) are more defensive but have still moved meaningfully. Investors should consider trimming these, though less so than high-beta independent E&Ps. The integrated majors offer dividend support on the downside, but the margin of safety has narrowed.
What to Hold More Confidently
Of course, not all energy equity segments carry the same risk profile. Some segments are better positioned regardless of how the conflict resolves.
Midstream companies remain well-positioned for long-term holding, given their recent price gains. Pipeline operators and MLPs, including my longtime favorite Enterprise Products Partners (EPD), Energy Transfer (ET), and MPLX (MPLX), have lower direct commodity price sensitivity. Their revenue is primarily fee-based and contract-driven. Midstream has outperformed through the conflict but with less volatility, and its relatively high yield provides a floor. These names form the core of income-oriented energy portfolios because they earn their profits through volume rather than price.
Natural gas-levered equities. I increasingly suspect the LNG angle in the current situation is underappreciated. Qatar’s LNG exports transit the Strait of Hormuz, and disruption to those flows has tightened global LNG markets. North American natural gas producers and LNG exporters operate entirely outside the disruption zone. Cheniere Energy (LNG) is one such example. These companies benefit from the crisis without bearing the risk of its resolution.
Canadian producers are another longstanding favorite of mine, and the structural case for holding them has strengthened beyond the geographic argument I would have made a month ago. Names like Canadian Natural Resources (CNQ), Suncor (SU), and Cenovus (CVE) are geographically insulated from Hormuz risk while benefiting from the combination of sustained higher oil prices and long-lived reserves. The demonstrated vulnerability of Middle Eastern supply infrastructure to military threats permanently increases the strategic value of reserves in politically stable countries with pipeline egress. Canada is the most obvious beneficiary. The market has not fully absorbed this structural shift. Furthermore, pipeline capacity out of Western Canada has improved in recent years and could improve further if political momentum for increased exports builds.
Signals to Trim More or Reverse Course
Historically, it has been prudent to exit energy stocks not when the war ends, but earlier, when the market decides the worst case is off the table. I would watch for these signposts:
Brent sustains below $100 per barrel. If Brent falls below $100 per barrel and fails to reclaim that level within a week, the risk premium is likely to deflate over time. This may be the market’s way of signaling that de-escalation is being priced in. It may be a cue to trim further.
Full Strait reopening or a credible diplomatic framework. Any formal agreement or a credible ceasefire with multinational guarantees would remove the core thesis for elevated prices. In this scenario, I would expect oil to gap down $15 to $20 in a matter of days.
Physical flow normalization. This requires tracking tanker traffic through the Strait. If Western-flagged vessels resume transiting, the supply picture will change materially before official announcements. However, even after a political resolution, the physical normalization of flows will lag by weeks to months. Vessel repositioning, insurance repricing, and cautious operator behavior will create a prolonged tail.
Narrative saturation. Investors should be on guard for moments of maximum complacency. This will be when the consensus shifts to the view that oil will remain far above $100 per barrel indefinitely and that the world has entered a new pricing regime. This will also be when the historical pattern of collapse becomes most likely. It is when the downside risk to E&P stocks is at its highest.
Brent breaks above $130 per barrel and holds. In this scenario, oil prices enter the region of demand curtailment. The market is likely pricing in a full escalation, or Scenario C above. At that point, I would sell my E&P holdings more aggressively, as oil and E&P stock prices will eventually retreat as demand is increasingly curtailed. However, depending on prices at the time, I may add to midstream and LNG names that would benefit from a longer-term dislocation.
Conversely, strategic hoarding is a leading indicator for reversing course, and not trimming. Watch for countries announcing export bans on refined products or accelerated SPR building programs. This behavior, which is already emerging, signals that governments expect a prolonged disruption and are competing for physical barrels. It is bullish for both crude oil and refining margins, and it extends the timeline for any normalization of global balances.
Conclusion
History is clear that war-driven oil rallies are unstable and tend to unwind as uncertainty declines. This episode is different in degree: the disruption is real, the chokepoint is critical, and the system’s capacity to absorb the shock is limited. These factors raise the pricing floor, but they do not eliminate the well-worn historical pattern.
Current prices already reflect a prolonged disruption. The upside from here is incremental, while the downside—though less severe than in past episodes—remains meaningful. That is sufficient to justify reducing exposure at the margin.
I intend to trim high-beta oil exposure by 10% to 15%. I will favor high-quality midstream positions, LNG, and Canadian producers, and I will adjust further as market signals indicate whether the risk premium is beginning to unwind or being reinforced.
Analyst’s Disclosure: Jon Costello has a beneficial long position in the shares of EPD, MPLX, ET, LNG, CVE, SU either through stock ownership, options, or other derivatives.
Great stuff, Jon, as always, and aligns with what I've been doing (trimming DVN, APA, and OXY on the way up; technically, those stocks have also gone vertical). But the massive drop in names like XOM yesterday was also a bit of a gut-check. One challenging thing in this sector, in my experience, is that money seems to move out of it fairly quickly. It makes me realize that my position sizes are (still) probably too large, despite having trimmed substantially since the war began.