
Introducing The Plutus HFIR Energy Income Portfolio

By: Jon Costello
The HFIR Energy Income strategy, now managed on the Plutus platform, has delivered a gross return of +278% since December 2020.
The strategy applies the investment approach I have practiced and published publicly since December 2020.
Portfolio construction emphasizes free cash flow growth, low turnover, and disciplined position sizing across the energy value chain, prioritizing long-term free cash flow growth and compounding over headline yield.
Energy income is still cheap. Midstream multiples sit in the high single digits to low double digits on EV/EBITDA, dividend yields across the income complex exceed 5%, dividend payouts are growing, and sector balance sheets are in the strongest shape they have been in fifteen years. That combination is rare in today’s U.S. equity market.
Given the opportunities we see and our track record of outperformance, we are now publishing our portfolio on the Plutus platform. Plutus connects individual investors with curated and thematic model portfolios from independent professional investment research managers. Its system allows an investor to replicate the researcher’s portfolio in their own investment account.
Through Plutus, investors can now access the HFIR Energy Income strategy. I will apply the same investment approach that I have practiced and published since we launched the strategy in December 2020. The portfolio structure, selection criteria, and emphasis on free cash flow growth carry over directly from what I have done on Seeking Alpha for more than five years. The approach has not changed.
Plutus Applies a Philosophy I Have Practiced Publicly for Five Years
My energy income investment philosophy has been public since the inception of the Energy Income portfolio. It is spelled out in this article, which was published when we launched the portfolio. Neither the article nor my approach to managing the portfolio has changed since then, which is borne out by the portfolio’s metrics. My approach is to buy equity in understandable businesses at discounts to conservative estimates of intrinsic value and hold for two to five years. I hold 10 to 20 names, concentrated around three or four ballast positions bought cheaply. I benchmark against the S&P 500 and treat outperformance as the best gauge of a manager’s skill, and I consider risk to stem from permanent capital loss, not paper drawdowns.
Outside of my five-year history with the HFIR Energy Income public tracking portfolio, my career spans 19 years. I have managed money independently and full-time since 2007, beginning as a generalist value investor across multiple sectors. Since 2016, I’ve been concentrated in energy, which has been my primary focus area since. Across both periods, I have managed portfolios for income and capital appreciation on my own platforms outside of HFIR. The HFIR Energy Income portfolio was launched at the end of 2020.
Returns
The HFIR Energy Income portfolio is a hypothetical model portfolio. Every buy, sell, add, and trim has been published on Seeking Alpha in real time since the portfolio’s inception on December 14, 2020. The tracker calculates what a subscriber would have earned by executing those decisions at published prices, gross of fees and taxes.
The HFIR Energy Income strategy has outperformed by a wide margin. The table below compares the gross record against two standard benchmarks.
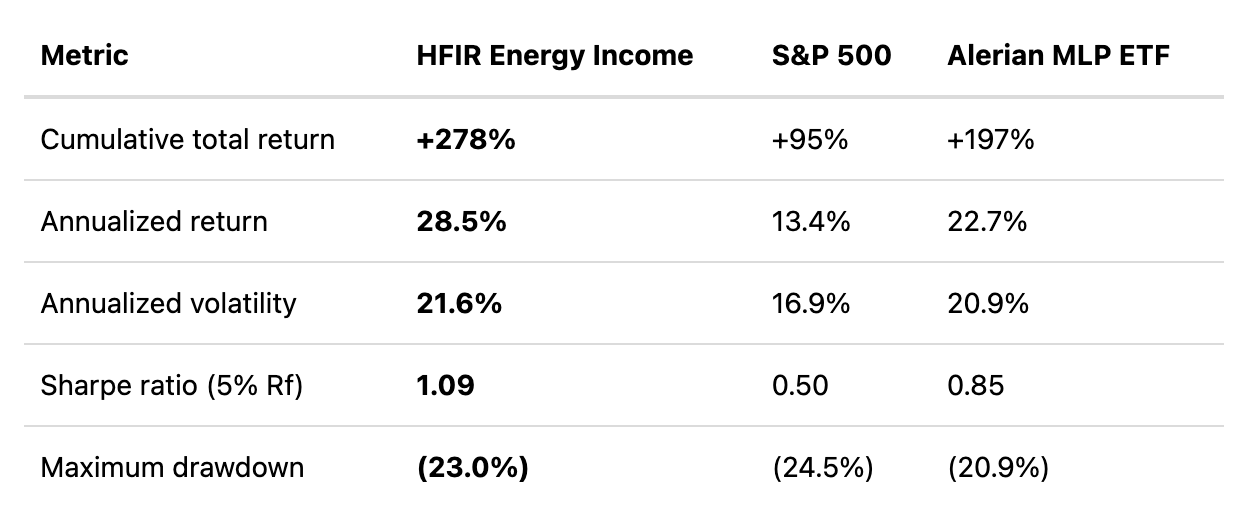
Source: Internal analysis of HFIR Energy Income trade ledger, December 14, 2020, through April 7, 2026. Benchmark return series derived from Yahoo Finance adjusted close (total-return-equivalent).
The aggregate number hides year-to-year dispersion. The table below shows calendar-year total returns since inception.
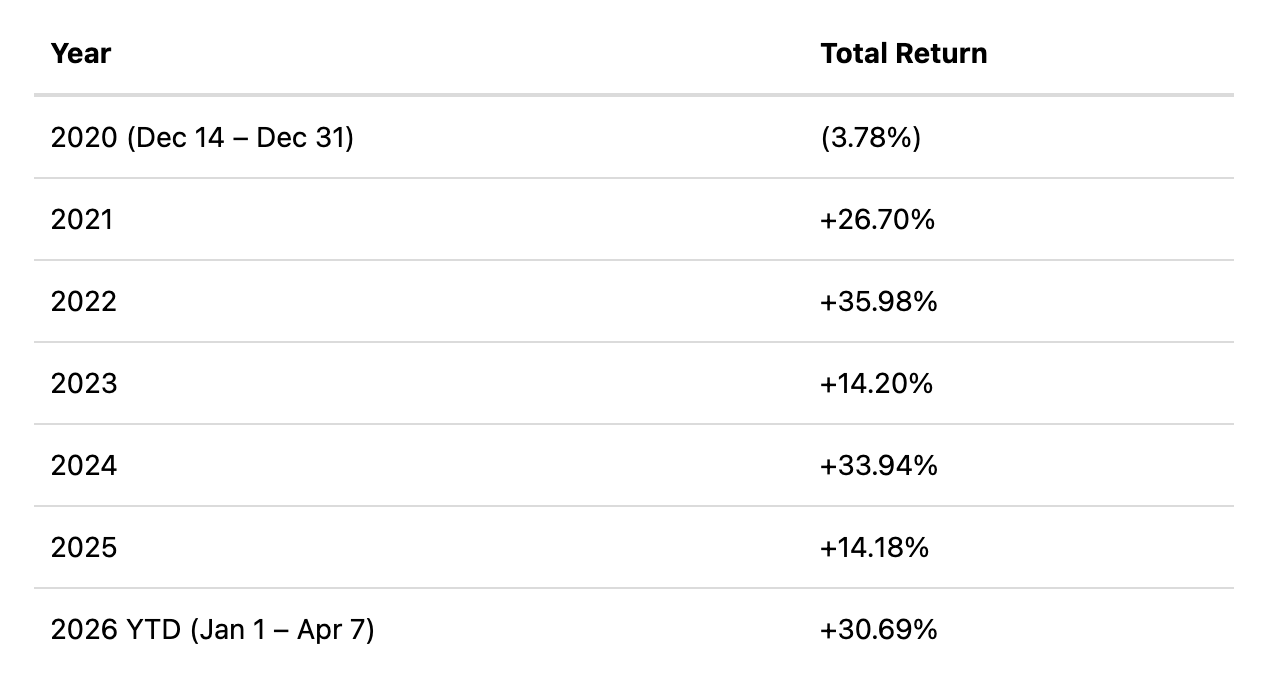
Source: Internal analysis of HFIR trade ledger. 2020 return spans December 14 through December 31, 2020 (17 days). 2026 YTD return spans January 1 through April 7, 2026 (partial year). All other years are full calendar years. Returns are gross total return (price appreciation plus distributions received).
No full calendar year has produced a loss. The only negative figure is the 17-day partial in December 2020. Dispersion across full years runs from +14.18% in 2025 to +35.98% in 2022, with 2024 adding a second-best +33.94% to the record. In 2023 and 2025, returns were in the low-to-mid teens, above the S&P 500’s long-run average, but worth noting as the periods when the strategy did not outperform the benchmark.
Cumulative dividends and distributions received total approximately $526,000 against a $1 million starting capital base.
The past hypothetical performance of the HFIR Energy Income portfolio is not predictive of future actual results. Also, the gross-of-fees performance figures overstate what a real-money investor would have earned. The numbers are directional evidence of a philosophy at work, not a guarantee of what our Plutus portfolio will deliver.
Free Cash Flow Growth Is the Real Guarantor of Income Safety
Most energy income portfolios optimize for a headline income yield in the here-and-now. However, I’d argue that the sustainability of an income stream is determined not by its current yield but by the underlying business’s ability to generate free cash flow and to grow and distribute that cash flow over time.
Consider the mechanics. A business with flat or declining free cash flow that pays out most of what it produces will eventually cut its dividend or weaken its balance sheet to maintain it. A business with growing free cash flow can safely raise its dividend and fund reinvestment, while protecting its balance sheet. Income safety is therefore a byproduct of operational and financial strength, not simply a product of payout ratios or yield levels.
Over time, growing free cash flow drives higher dividends. Higher dividends, in turn, lead to a higher stock price as the price increases to maintain the stock’s yield. Meanwhile, free cash flow growth can lead to a multiple re-rating.
The upshot of the HFIR Energy Income strategy of prioritizing free cash flow growth is that the portfolio has generated roughly four times more return from capital appreciation (+226%) than from income received (+53%). That ratio surprises investors who assume an income portfolio should be primarily an income story. It is not. It is a quality-compounding story that pays a dividend along the way.
One implication of this strategy is that our Plutus portfolio will likely have a lower current yield than peer energy-income portfolios that optimize for present-day cash generation. This is partly a result of our portfolio having purchased equities at lower prices when their dividend yields were significantly lower and holding them as their dividends and market prices increase. I would rather hold a position yielding 5% today whose distributable cash flow grows 10% annually than one yielding 8% today whose distributable cash flow is flat or falling. Over a full cycle, the former position benefits from receiving both income and attractive total returns.
Plutus Spans the Entire Energy Value Chain
In the energy sector, relative value rotates across sub-sectors. Across the HFIR Energy Income portfolio’s 77 trades to date, it has owned names in upstream E&P, gathering and long-haul pipelines, refining and specialty chemicals, LNG export, and royalty and mineral streams, in both U.S. and Canadian operators. Restricting the mandate to any single sub-sector would cost performance over a full cycle.
Our Plutus portfolio is built on the same principle. As of April 1, 2026, the equity book broke down as follows.
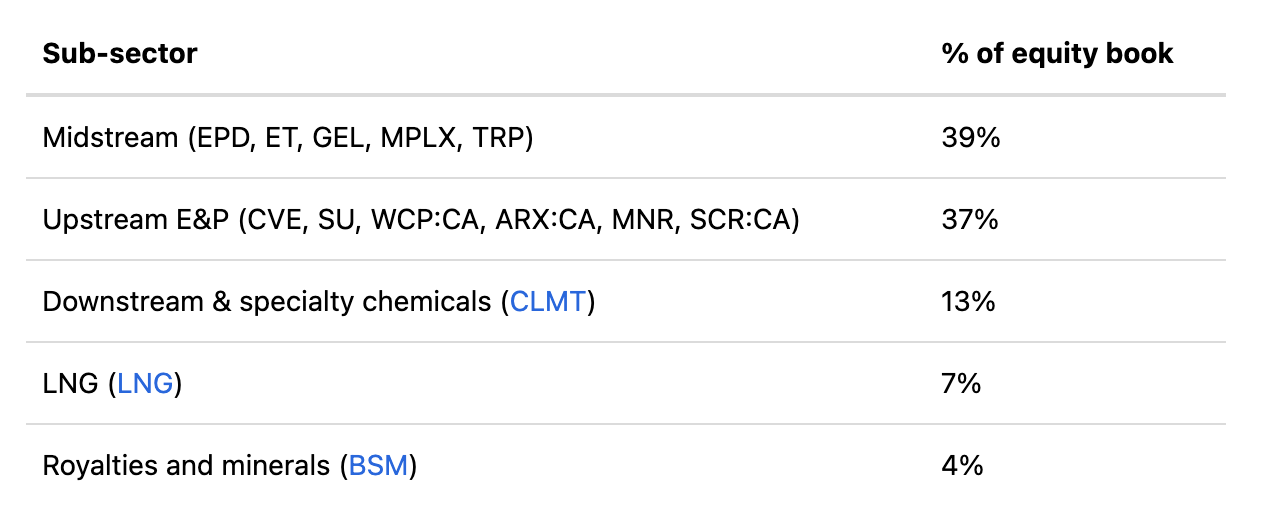
Source: Plutus portfolio weightings as of April 1, 2026; percentages expressed as share of the 90.3% equity component (excludes 9.7% SGOV allocation).
The portfolio has 15 equity positions. A small cluster of top names serve as ballast; the remainder are rotating conviction positions. The structure matches my longstanding concentrated value investment philosophy.
Low Turnover Boosts Returns
Patience pays over the long term. The HFIR Energy Income portfolio has executed 77 trades over approximately 5.3 years, or roughly 14.5 trades per year, across a portfolio that typically runs ten to twenty names. The annualized turnover ratio sits at 16.9%, and the cost-weighted average holding period is 2.18 years. That falls within my stated two-to-five-year target and demonstrates that I am holding positions long enough for the thesis to work without being married to them.
The table below summarizes the turnover profile.
Metric
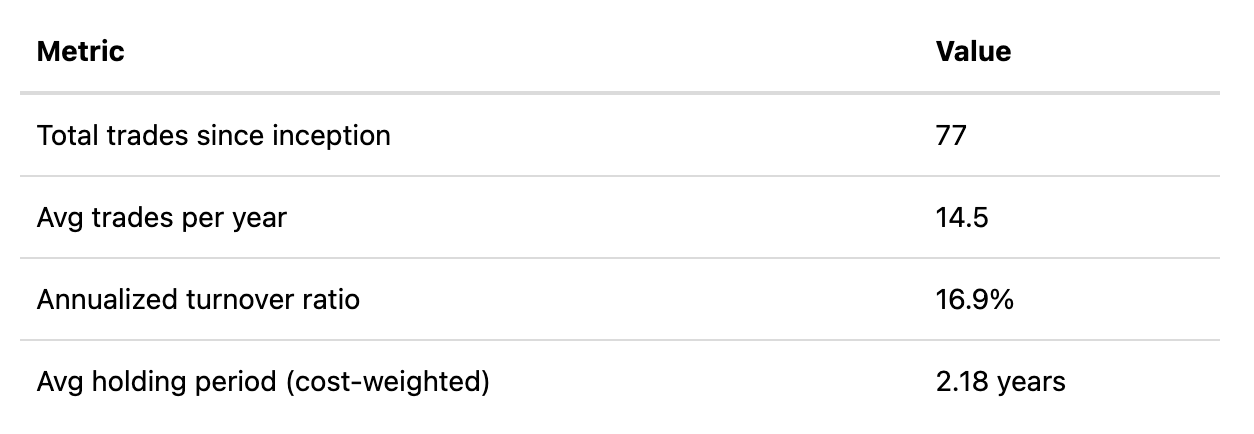
Source: Internal analysis of HFIR trade ledger, December 14, 2020, through April 7, 2026. Annualized turnover ratio = the lesser of buy/sell volume per year, divided by average portfolio value.
Low turnover matters for three reasons. It keeps transaction costs down across a full cycle. It signals that position sizing was conviction-led, not reactive. And it reduces the churn that degrades after-tax returns in taxable accounts. The Plutus portfolio will be run with the same discipline.
The Treasury Bill Component Reflects Discipline, Not a Hedge
The portfolio holds a 9.7% position in Treasury bills through SGOV, a short-duration U.S. Treasury ETF. This holding is deliberate but does not reflect a market-timing posture. Energy is structurally volatile, and volatility creates the entry points that drive a value investor’s returns. Maintaining a liquid, low-risk component of the portfolio will allow me to deploy into dislocations as they appear, without being forced to sell existing positions at the wrong time.
The HFIR Energy Income portfolio has been building an opportunistic cash position since 2025 by retaining income from dividends and distributions. In an environment of elevated sector volatility and with a selective pipeline of opportunities, the buffer is the right posture. I expect to deploy all of the portfolio’s cash when opportunities become sufficiently attractive.
Risks
Commodity prices. A sustained collapse in oil and gas prices reduces free cash flow for several of the portfolio’s holdings. Midstream and LNG exposure provides a buffer, but does not eliminate this risk.
Dividend or distribution cuts at specific holdings. The concentrated nature of the portfolio’s holdings means a dividend cut at a top position would affect the portfolio’s yield and/or dividend growth.
Policy risk. U.S. energy policy has become more volatile in 2025 and 2026. Permit delays, pipeline cancellations, and LNG export restrictions could affect specific names.
Tax implications. Each investor must manage their income investments according to their own tax situation. Income-producing securities generate ordinary income, qualified dividends, K-1 pass-through income, and return-of-capital distributions, each of which is taxed differently. MLPs held in retirement accounts can trigger UBTI; Canadian holdings are subject to withholding. Mismatched account placement can lead to unwanted tax consequences.
Canadian exposure. Whitecap Resources, Cenovus Energy, Suncor Energy, Strathcona Resources, and ARC Resources carry Canadian-dollar exposure and WCS-WTI differential risk. Historically a source of alpha, it can turn into a drag if differentials widen.
Disclosures and Terms
Our Plutus Energy Income model portfolio carries a 1% annual management fee and no performance fee. The HFIR Energy Income portfolio’s returns cited above do not reflect any management fee. Applying a 1% annual fee would reduce the compounded return. Prospective investors in Plutus should evaluate net-of-fee projections.
We have a compensated relationship with Plutus. This article is published under our Seeking Alpha byline as an educational piece on investment philosophy and portfolio construction. It is not an offer to sell or a solicitation of an offer to buy any security. Investment decisions regarding Plutus should be made based on the fund’s official offering documents and after consultation with qualified legal, tax, and financial advisors. MLP investments carry specific tax considerations, including Schedule K-1 filings and potential UBTI implications in retirement accounts, which may affect suitability for individual investors.
Conclusion
The investment thesis that underpins our energy income portfolio is durable. Energy income securities still offer yields in excess of most other cash-flowing assets in U.S. public markets, the underlying businesses are financially stronger than they have been over the last fifteen years, and LNG, gas, and midstream demand continue to expand. The philosophy I have practiced for the past five years has produced a hypothetical return of 278% against the S&P 500’s 95% over the same period. Plutus applies that discipline to real capital.
I believe the strategy will continue to compound. I am using Plutus to provide access to investors who cannot or prefer not to manage a 15-name energy portfolio themselves. Investors interested in modeling the HFIR Energy Income approach should visit the Plutus site for more information.
Analyst’s Disclosure: Jon Costello has a beneficial long position in the shares of the HFIR Energy Income Portfolio and the HFIR Energy Income Plutus Portfolio either through stock ownership, options, or other derivatives.