(Idea) Energy Transfer Is Back In The Buy Zone
By: Jon Costello
Energy Transfer, LP’s (ET) recent selloff to $16.60 has put its units squarely in the Buy range for long-term investors looking for both yield and capital appreciation.
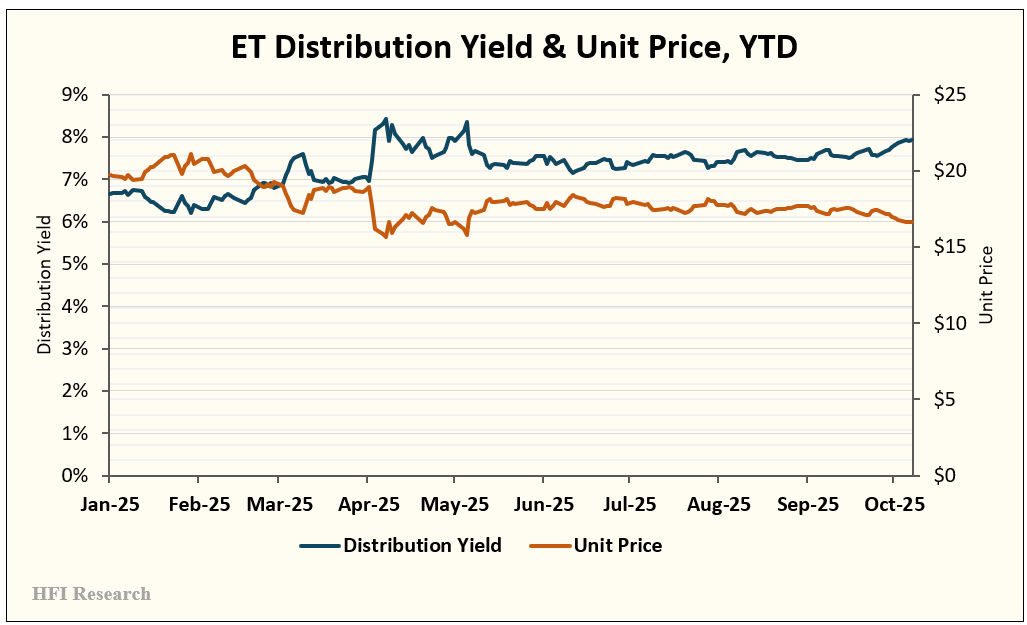
Year-to-date, ET units have significantly underperformed their large-cap midstream MLP peers, Enterprise Products Partners LP (EPD) and MPLX LP (MPLX). ET’s units have fallen 15.4% year-to-date. Over the same period, EPD units are flat, and MPLX units are up 1.2%.
At its current unit price, ET trades at an EV/EBITDA ratio of approximately 7.4-times, versus 10.0-times for EPD and 10.1-times for MPLX. Its EV/EBITDA multiple has fallen from 8.5-times at the beginning of the year.
The decline in ET’s unit price has pushed its distribution yield up to 8.0%, well above the 6.8% and 7.8% yields on EPD and MLPX units, respectively. ET’s distribution yield is above its recent norm in the mid-to-low 7% range. The poor year-to-date performance of ET’s units and their rising distribution yield are illustrated below.
A two-year chart of unit price versus yield is shown below.
Given the current interest rate environment relative to recent history, along with the outlook for low rates, ET’s yield stands out as one of the most attractive in the energy sector. While I don’t expect much by way of distribution growth from the current level, the potential for capital appreciation makes the units particularly appealing from a total return perspective.
Reasons for Investor Bearishness
I believe investor bearishness toward ET stems largely from concerns that the company is ramping up its leverage and is putting its unitholders at risk—again.
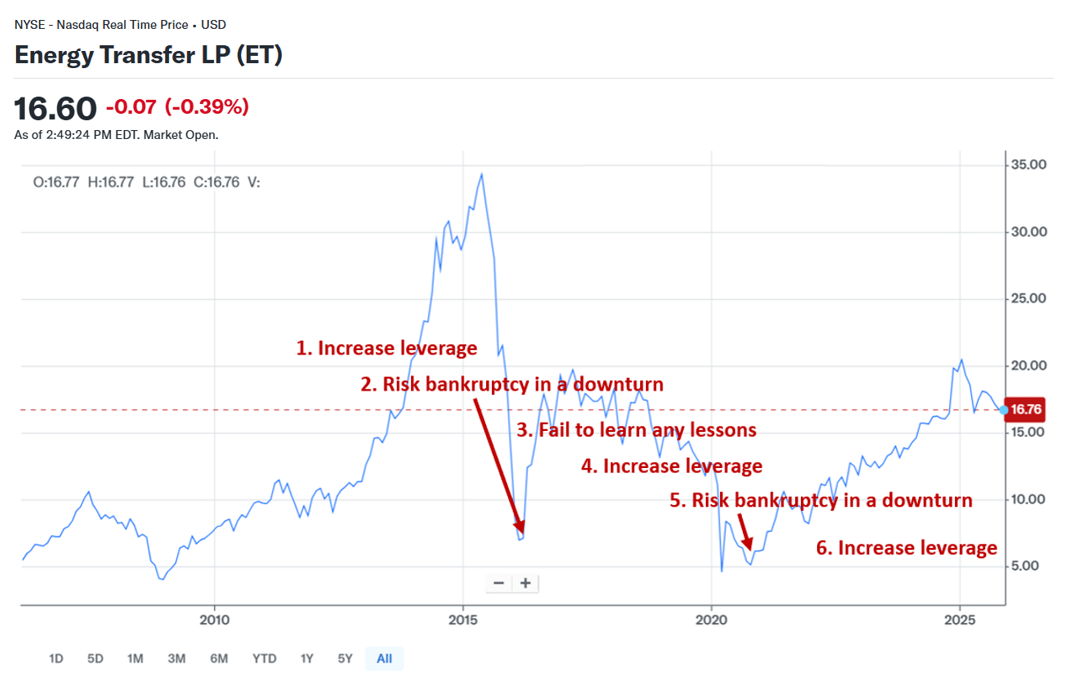
Over the past two decades, ET’s aggressive expansion through large organic projects and acquisitions caused it to regularly outspend its cash flow. On two occasions, high debt levels put ET unitholders at high risk of severe permanent loss.
The first was in the 2015-2016 timeframe, when its hostile run to acquire Williams (WMB) coincided with an industry downturn. The episode caused ET units to lose 89% of their market value in a mere seven months.
Equally problematic was that ET’s brush with disaster failed to correct the company’s reckless spending habits. In 2015, 2016, and 2017, ET outspent its operating cash flow on a consolidated basis by $5.2 billion, $4.3 billion, and $3.8 billion, respectively, while having a much smaller asset base than today. The overspending caused long-term debt to balloon from $36.8 billion to $43.6 billion in 2017. ET targeted a leverage ratio of 4.5-times during this period, too high for comfort for what was a liquids-weighted midstream operator at the time.
During this period, ET units traded in the mid-teens on average.
When the Covid downturn hit in 2020, ET’s high leverage once again put it at risk of breaching its debt covenants if its Adjusted EBITDA fell. The prospect of decreasing throughput capacity amid declining oil and gas production increased investor concerns. By March, the units had dropped as low as $3.75.
After 2020, ET assiduously paid down debt and grew Adjusted EBITDA. The company deserves credit for changing its ways for the better. It also amassed a vertically integrated natural gas midstream system that will serve it well for many years.
Despite the turnabout from 2020, ET unitholders have good reason to be wary of the company’s overspending, given its history. In fact, a similar sequence of events seems to be repeating, as illustrated on the chart below.
Source: Yahoo! Finance, Oct. 9, 2025. Red text added by author.
The company currently finds itself at point #6 in the chart above, where leverage is increasing.


